Time required: 12 minutes (9 minutes are spent in downloading the software:) )
Python is one of the 2 most popular data analysis environment. It has various libraries to help perform almost all the data analysis jobs from the basic statistic packages to machine learning to data visualization. In this post, we show how to easily install your python environment that is suitable for the data analysis jobs in 3 steps.
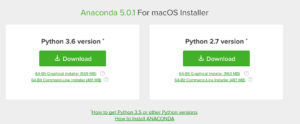
1. Download Anaconda
There are many steps to configure a usable environment, including installing Python, its various packages (e.g. Pandas, Numpy, etc), iPython… In the future there are also troublesome stuffs when you want to install other packages or update the existing ones. Fortunately, now Anaconda helps solve all the problem. It has a GUI-based installation guide, which helps you install all the required packages including Python itself. All you have to do is to download and click “Next”:)
Go to https://www.anaconda.com/download/ (as the picture below), select a Python version and download.Both versions are totally OK. You can select the Python version you prefer. If you don’t know Python at all, just make a random choice, or select 3.X version (a higher version number at least looks like better, doesn’t it:) ).
2. Install Anaconda and launch iPython notebook
Well, installation is no brainer. Just click next until it is done.
After the installation, you are ready to launch the Jupyter notebook. It is really a nice web-based GUI to help you save and test any data analysis project. You can start it either through command line (yes you can also use Python from command line now) or Anaconda’s navigator. For the beginners, why not avoid the command line for a while? So just start “Anaconda Navigator” from your Applications (Mac) or the start menu (Win). You will see the following interface:
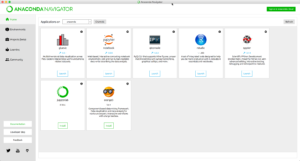
You will see a couple of applications you can use. For now, just click the Launch button under “Jupyter notebook”. It automatically starts a new web browser with the URL and interface:
3. Test the installation
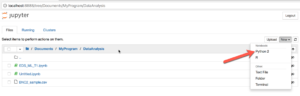
Let’s run a simple program to test the installation. In the browser, go to a folder where you want to store your analysis scripts. Then click “New” and “Python” (as in the above picture). Input the code below (code snippet from https://elitedatascience.com/):
import pandas as pd
dataset_url = 'http://mlr.cs.umass.edu/ml/machine-learning-databases/wine-quality/winequality-red.csv'
data = pd.read_csv(dataset_url, sep=';')
data.head()
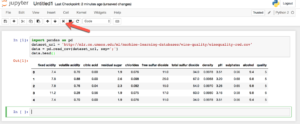
Hit the “run” button marked by the arrow. The program reads a csv data file from a remote url, and separate the fields with “;”. Then it prints the first few rows.
Next
Congratulations! Your environment is set up successfully. The next thing is to dive into the Python libraries to build your analysis. There are a lot of tutorials on using Python for data analysis, including quite a few free books such as: Think Stats: Exploratory Data Analysis in Python . Check them out and, Happy Analysis!
Recent Comments